As a coach do you know who is improving the most on your team? In actuality, you might not.
I started this project while I was head coach for a large high school race team. I wanted to put an emphasis on dedication to process and individual improvement. As part of this, I began thinking about ways that I could reward and recognize those on the team that were showing the most improvement as much as recognizing those that were the best on the team. Part of this emphasis was to come up with a way to measure improvement in race results. With a combined team of 50 racers, I wanted to be able to pick out the top 3 most improved racers on both the girls and boys teams each race. Each week the most improved would be recognized alongside the week’s top finishers.
However, trying to objectively determine who was most improved in actual races was surprisingly difficult. It is easy to say who performed better in a race – 3rd is better than 4th. However, moving from a placement of 5th one race to 3rd on the next does not in itself, indicate improvement in performance - even though many skiers, parents, and coaches act as if it does. A skier’s change in placement from one race to the next can happen for a myriad of reasons not related to improvement in the skier’s performance. I can remember one example of a skier who was a perennial 5th placer suddenly having two races of podium finishes. The skier himself, his teammates, and parents spent the two weeks talking about how he had improved so much. Even the coaches weighed in, picking out how his success in following each of their own separate pieces of advice had finally paid off. At that time, I had just started piloting an improvement measure and I could see in the actual data that he had not improved at all. He skied exactly to his past average performance. All the attention to his supposed improvement was misplaced and false; and the coaches’ comments were unfounded. However, there was no way to know this without the objective data. In reality, the “improvement” was a combination of two different skiers above him missing races and a few skiers having sub-par performance and mistakes. I began to suspect that too much of our reactions to race results was like this example and I started to think of a more data driven approach.
In a sport like swimming, where there is a consistent course and task. A decrease in time from one day to the next is a simple, valid measure of one’s improvement. However, each ski race is different and takes place on different venues under different conditions. The length, the number of gates, and the difficulty of the courses vary from one race to the next, making a comparison of one race time to the next invalid. A skier can consistently be a top finisher and never improve the whole season Similarly, a skier can be a last place finisher through the season and improve tremendously while continuing to place last. In these examples, even if the skiers did improve, one could never know based on their finishes alone.
In my observations, coaches most often determine improvement by simply judging whether the skier demonstrates some set of training elements on race day (eg., whether the skier demonstrates certain technical behaviors, chooses tactics wisely, performs good psychological habits, etc., etc.,). This approach seems reasonable because these elements constitute the skier’s training that we as coaches have decided are important. However, the exact nature of the connection between these elements and race results is most often truly unknown – a matter of experience and personal faith. The problem is that without a good measure of improvement in the actual results, coaches’ judgements of the connection between what they have coached and improvement on race day are subject to all sorts of bias, favoritism, and self flattery.
A more objective process linked to actual race results was needed that could compare a skier’s result with that own skier’s past performance. I needed something akin to a student grade and a student GPA, then, each race, I could ask if (and how much) a skier’s race ‘grade” had improved from their established racing GPA.
My goal was to develop an actual spreadsheet of each racer’s “racing GPA” along with their grade (time) for the race and I needed everything in a format that could be validly compared from race to race. With an improvement spreadsheet I could give more valid feedback to the individual and I could highlight those on the team that were objectively most improving. Further, I could begin ask real data-informed questions about why improvement was or was not happening.
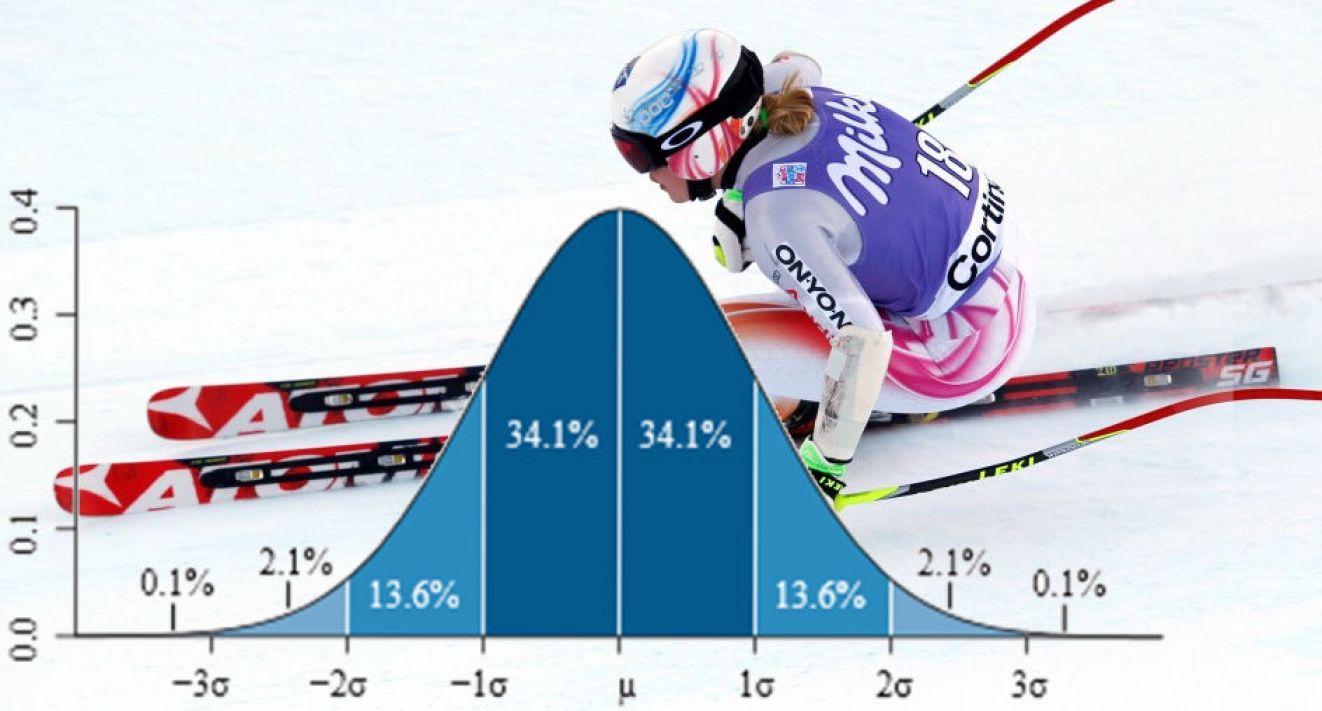
Direction came from a relatively obscure applied mathematics paper that examined the use of Z Scores to look at golfers’ performance in several years’ data from the PGA. The paper examined the details of statistical assumptions and issues in applying z-scores to the actual sports data. Near the end of the paper, the authors noted a curious thing about Tiger Woods’ pattern of Z-scores. He was not just the best golfer in those years (that was already obvious by his consistent first place finishes), his z-scores suggested that he was “pulling away from the other golfers” in his performance. A testament to his work ethic and focus, even though he was the best of the best, he continued to improve tremendously. This observation was what I needed to begin formalizing a measure of improvement using Z-score data.
One can navigate the different tables and pages related to this topic using the improvement tables menu bar above. Included are the details of the methodology, my observations and comments, a few years of WC data (I will be adding to this), and the finished spreadsheets for my team’s competitive league.